Voyager
Voyager Golden Record
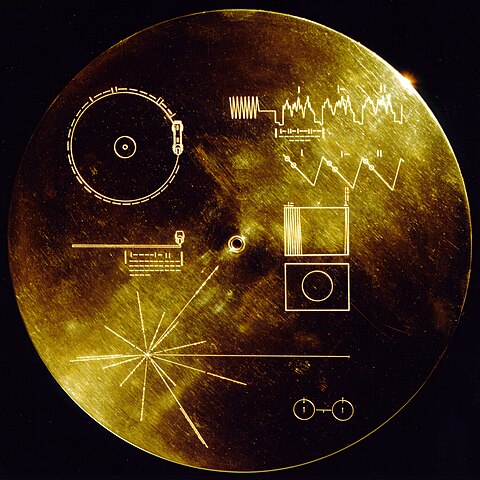 The Golden Record was launched with the Voyager spacecraft and included both audio recording as well as audio-encoded images. One side of the record has a pictographs to try to explain how to decode the waveforms and shows the calibration circle that results from the first image.
Raw data plot
 Just plotting the audio data in the wave file (available from archive.org/details/Voyager1) shows that there is clearly some information in the audio. Experimtentally plotting the data at various widths reveals that approximately every 380 samples there is a roughly periodic band that indicates start of new (vertical) scanlines and begins to reveal some "text" that can almost be read.
I'm not sure if it is just the quality of the recording at archive.org or other issues, but the number of samples per scanline seems to vary quite a bit. This might be due to a wobbly record player, which makes me wonder if the recording is from some sort of home copy rather than an original master. It also has had some sort of auto-gain applied, which creates the very washed-out look to the images.
Simple signal processing
 Applying some signal processing to the image to restart scan lines after the strong pulses produces something that can clearly be seen as the calibration circle, the mathematical constants and some of the other forms. It will require more analysis to extract clearer images -- I wish higher quality recordings were available.
Image Comparison
The original images are copied from Scenes from Earth, JPL's site about Voyager and the comparisons were generated with my signal processing code at github.com/osresearch/voyager.
 Image #1 is a calibration circle, which also appears engraved on the record. This ensures that the decoding is the correct aspect ratio and that the scan line decoding is working.
 I note that the solar location map, image #2, appears upside down compared to the official version. This worries me -- how will ET know how to find out planet if the image is rotated? NASA should send a follow-up probe with a correction as soon as possible.
 Image #3 explains our base 10 numbering system and exponential notation, using binary codes of "|" and "-" marks.
 Image #4 is an attempt to express physical units in terms of the oscillation of the Hydrogen(?) atom.
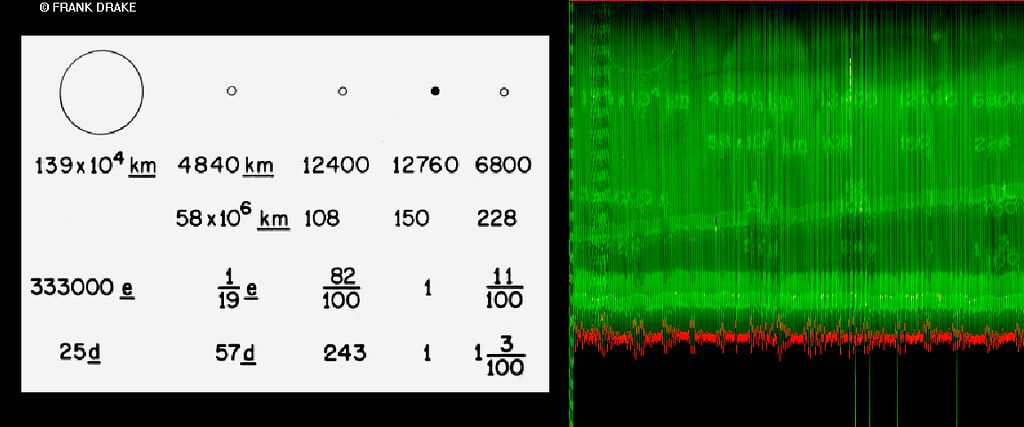 Image #5 returns to the solar system and expresses the distance of the various planets from the sun as well as their radii. It also marks the third planet as special, since that is where we come from.
 Image #6 continues the solar system map with the remaining planets, including the controversial ninth planet, Piuto.