plotter.vision - STL to SVG

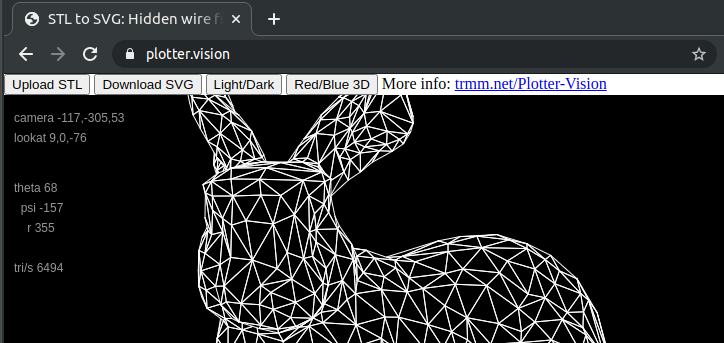
plotter.vision is a single-serving website that lets you upload 3D STL files, interactively position them, and then renders them with hidden wireframe removal as well as coplanar triangle elimination and backface culling. It's perfect for #plottertwitter and devices like the AxiDraw from EMSL or polargraph whiteboard plotters.
Controls
-
"
Upload STL", which supports both ASCII and binary STL files. Low-poly is best; around 8k triangles seems to be near the limit for decent plotting. The triangle occlusion algorithm is roughly n^2 in runtime, so doubling the number of triangles quadruples the time to render. -
"
Download SVG" should produce a file that is suitable for loading into inkscape or other tools. There are duplicate edges since each triangle has an edge, so optimizing before plotting is important. -
"
Light/Dark" switches from a black background to a white background. -
Left/Right arrow keys, Left mouse button, or dragging on touch screen rotates the camera position and should be free of gimbal lock issues.
-
Shift + Left mouse button adjusts the "Look at" point, which is also the center of rotation.
-
Scroll wheel, or Up/Down arrow keys zooms the model.
-
1,2,3,4,5move to front, left side, back, right side, top views. -
"
Red/Blue 3D" orttoggles anaglyph mode.
Tip
There are also global variables that you can change via the browser console, although I haven't documented them yet.
Anaglyph mode

plotter.vision also has a red/blue anaglyph 3D mode that renders the STL file from two slightly different viewpoints. On screen it is best with the light background using normal glasses (red on the left eye, blue on the right); many people report that with the dark background they have to wear the glasses with the eyes switched (red on the right, blue on the left). When in anaglyph mode there is an eye separation slider that allows adjusting of how far apart the two virtual cameras are located.
Tip
Anaglyph images are best plotted with a cyan pen, rather than dark blue, since the glasses tend to be better at filtering out the lighter colors.
Tip
The "Look at" point defines the zero separation distance, where the red and blue lines overlap. By using Shift+Left mouse button to adjust the look at point to be behind the object, you can exagerate the "off-the-page" feel of the resulting plot.
Source code
The source code is available from github.com/osresearch/plotter-vision and
is implemented with p5js, a port of Processing to Javascript.
It is not very fast, although still very workable for the sort of models
that you probably want to plot.
I'm also not a very experienced Javascript programmer, so plotter.vision is probably really wrong in many ways. Pull requests and issues are welcome!